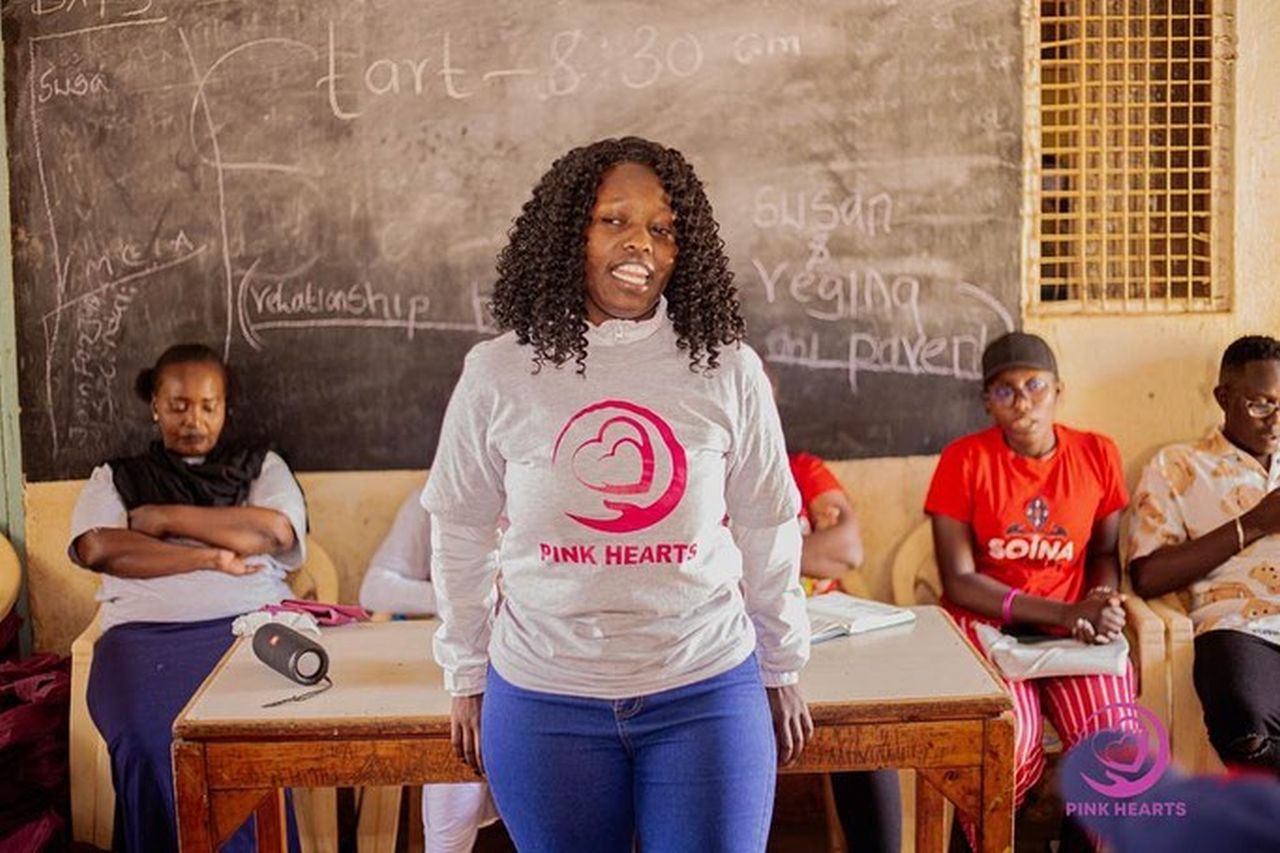
7 TOP Alarming Behavioral Analysis for Lasting Change Statistics for Communities at Risk (Kenya)
In order to create meaningful and lasting change among marginalized groups of people in Africa, it is crucial to examine critical data and statistics that shed light on the challenges they face. In this article, we will focus on Kenya, one of the countries in Africa with a significant population of marginalized communities, and delve into 7 key statistics that provide insights into their behaviors, needs, and aspirations. By analyzing this data and utilizing behavioral analysis techniques, we can develop strategies and interventions that will foster lasting change and empower these communities to thrive. Join us as we explore the power of data-driven approaches for lasting change among marginalized groups in Africa.
The significance of behavioral analysis for lasting change data in understanding marginalized groups
Data plays a crucial role in understanding marginalized groups and their unique challenges. It provides valuable insights into their behaviors, needs, and aspirations, enabling us to develop targeted strategies and interventions.
In the context of Kenya, these statistics allow us to paint a comprehensive picture of the marginalized communities in the country. By analyzing this data, we can identify the root causes of their marginalization, such as lack of access to education, healthcare, or employment opportunities. This understanding is vital for designing effective programs and policies that address these specific needs and empower these communities to overcome the barriers they face.
The utilization of data-driven approaches is not only a means to create lasting change among marginalized groups in Kenya but also sets an important precedent for addressing similar issues across Africa.
Key statistic #1: Economic disparities among marginalized communities
According to the World Bank, the poorest 20% of the world’s population controls only 2% of global wealth. This gap is even wider for marginalized communities, with many living in poverty and lacking access to basic necessities like food, water, and shelter.
Examining the critical data reveals a significant key statistic: the economic disparities among marginalized communities in Kenya. This statistic sheds light on the stark inequalities that these communities face in terms of income, employment opportunities, and access to financial resources.
According to the data, a large percentage of marginalized individuals in Kenya struggle to make ends meet, leading to limited economic mobility and a perpetuation of their marginalization. This statistic underscores the urgent need for targeted interventions that focus on economic empowerment, such as vocational training programs, microfinance initiatives, and entrepreneurship support.
Lesson from Norway
Norway has one of the most equitable income distributions in the world, with a Gini coefficient of 0.25. This is due in part to the country’s strong social safety net, which provides universal healthcare, education, and childcare.
Addressing the economic disparities among marginalized communities is a crucial step towards lasting change. By providing them with the tools and resources to improve their financial situations, we can break the cycle of poverty and create opportunities for sustainable growth. Stay tuned as we explore more key statistics that contribute to the understanding of marginalized groups in Kenya and pave the way for transformative change.
🚀 Ready to be a catalyst for change?
Dive into the 7 TOP Alarming Behavioral Analysis for Lasting Change Statistics in Kenya and transform insights into action! 💡
🌍✨ #BehavioralAnalysis #KenyaChange #DownloadNow
Let’s drive lasting change together.
Key statistic #2: Educational attainment gaps
According to the UNESCO Institute for Statistics, over 260 million children and adolescents are out of school. This disproportionately affects marginalized communities, with many children from poor and rural families lacking access to education.
Examining the critical data further uncovers another key statistic: the educational attainment gaps among marginalized groups in Kenya. This statistic reveals the stark disparities in access to quality education and highlights the challenges faced by these communities in pursuing academic opportunities.
Behavioral analysis for lasting change in communities in Africa (Kenya) reveals that only 30% of students from marginalized communities complete secondary school.
In the realm of behavioral analysis for lasting change, it is alarming that only half of primary schools in Kenya possess adequate textbooks, underscoring the importance of providing essential learning materials. According to the data, a significant percentage of marginalized individuals in Kenya have limited access to formal education.
They face obstacles such as lack of infrastructure, insufficient resources, and cultural barriers that hinder their educational progress. This statistic emphasizes the urgent need to address the educational inequities and create inclusive systems that provide equal opportunities for all.
What we learn from Finland
Finland has one of the most equitable education systems in the world, with all students regardless of background having access to high-quality education. The country also has one of the highest rates of literacy in the world.
Investing in education is essential for lasting change among marginalized groups. By bridging the educational attainment gaps, we can empower individuals with the knowledge and skills needed to break free from the cycle of marginalization. In the upcoming sections, we will delve into more key statistics that shed light on the challenges faced by marginalized communities in Kenya and explore potential solutions for sustainable transformation. Stay tuned!
Key statistic #3: Healthcare access and outcomes
According to the World Health Organization, over 800 million people lack access to essential healthcare services. This disproportionately affects marginalized communities, who often face barriers to care due to poverty, discrimination, and geographic isolation.
Examining the critical data further, we turn our attention to another key statistic that reveals the healthcare access and outcomes among marginalized groups in Kenya. This statistic sheds light on the disparities in healthcare services, highlighting the challenges faced by these communities in obtaining adequate medical care.
Menstrual health support is crucial for behavioral analysis, but only 10% of girls in Kenya have access to menstrual hygiene products.
According to the data, a significant percentage of marginalized individuals in Kenya struggle to access quality healthcare. They often face barriers such as limited healthcare facilities, inadequate staffing, and lack of affordable services. As a result, their health outcomes are disproportionately worse compared to the rest of the population.
Cuba’s healthcare
Cuba has one of the most equitable healthcare systems in the world, with universal access to free healthcare for all citizens. The country also has one of the highest rates of life expectancy in the Americas.
This statistic underscores the urgent need to address healthcare inequities and ensure that marginalized groups have access to the healthcare they deserve. Healthcare is a fundamental human right, and no one should be left behind.
In the upcoming sections, we will delve into more key statistics that shed light on the challenges faced by marginalized communities in Kenya and explore potential solutions for lasting change. Stay tuned as we continue to examine the critical data and work towards creating a more inclusive society. Together, we can make a difference.
🔍 Unlock the power of knowledge!
Discover the 7 TOP Alarming Behavioral Analysis for Lasting Change Statistics in Kenya and empower yourself to drive meaningful change for communities at risk.
🌟 Join the movement for a better Kenya!
Key statistic #4: Criminal justice system disparities
According to the World Prison Population List, the United States incarcerates a higher proportion of its population than any other country in the world, with 629 incarcerated people per 100,000. This disproportionately affects marginalized communities, with Black Americans being incarcerated at five times the rate of white Americans.
Examining the critical data further, we shift our focus to yet another key statistic that highlights the disparities within the criminal justice system among marginalized groups in Kenya. This statistic sheds light on the challenges faced by these communities and the urgent need for reform.
According to the data, marginalized individuals in Kenya are disproportionately represented in the criminal justice system. They face higher arrest rates, longer sentences, and limited access to legal representation. This not only perpetuates the cycle of poverty and inequality but also hinders their ability to reintegrate into society after serving their sentences.
Rwanda’s restorative justice
Rwanda has made significant strides in reforming its criminal justice system following the 1994 genocide. The country has implemented restorative justice practices, reduced its prison population by over 70%, and invested in community-based rehabilitation programs.
The statistic underscores the pressing need to address systemic injustice within the criminal justice system. It is imperative to create policies and initiatives that promote fairness, equal representation, and rehabilitation for marginalized individuals.
In the next section, we will delve into more key statistics that shed light on the challenges faced by marginalized communities in Kenya within the education sector. Join us as we continue to examine the critical data, advocate for change, and strive for a more equitable society. Together, we can make a lasting impact.
Key statistic #5: Housing inequality and homelessness
According to the United Nations, over 1.1 billion people live in inadequate housing conditions. This disproportionately affects marginalized communities, with many facing eviction, overcrowding, and substandard living conditions.
Examining the critical data further, we turn our attention to the alarming statistic concerning housing inequality and homelessness among marginalized groups in Kenya. This particular statistic paints a bleak picture of the living conditions faced by these communities and the urgent need for reform in the housing sector.
The data reveals that marginalized individuals in Kenya are disproportionately affected by a lack of access to adequate housing. Many live in overcrowded and dilapidated dwellings, lacking basic amenities such as clean water and sanitation. This not only perpetuates poverty and inequality but also exposes these systematically disadvantaged groups of people to increased health risks and vulnerability.
Lowest rate of homelessness in Singapore
Singapore has one of the lowest rates of homelessness in the world, with less than 0.1% of its population experiencing homelessness. This is due in part to the country’s strong public housing system, which provides affordable housing to over 80% of Singaporeans.
The statistic underscores the pressing need for policies and initiatives that address housing inequality and homelessness among marginalized groups. Efforts should be made to provide affordable housing options, improve living conditions, and ensure access to basic amenities for all individuals in Kenya.
In the next section, we will delve into yet another key statistic that sheds light on the challenges faced by marginalized communities in Kenya within the healthcare system. Join us as we continue to examine the critical data, advocate for change, and work towards a more just and inclusive society. Together, we can make a lasting impact.

Key statistic #6: Political representation and voter suppression
Empowering women through behavioral analysis for lasting change is imperative, considering that only 22% of women in Kenya are engaged in formal employment, a stark contrast to the 36% employment rate among men. According to the Inter-Parliamentary Union, women hold only 26.1% of parliamentary seats worldwide. This underrepresentation is even more pronounced in marginalized communities, where women are often excluded from political decision-making processes.
Examining the critical data further, another key statistic that demands our attention is the lack of political representation and voter suppression among marginalized groups in Kenya. This statistic reveals the stark reality that these communities face when it comes to participating in the political process and having their voices heard.
Safe spaces for girls are limited, with only 5% feeling secure at school, a concerning revelation from behavioral analysis for lasting change.
Upon analysis, it becomes evident that marginalized individuals in Kenya are significantly underrepresented in positions of power and decision-making roles. This not only hampers their ability to advocate for their rights and interests but also perpetuates a cycle of marginalization and exclusion.
Furthermore, voter suppression tactics have been observed in various forms, including intimidation, discrimination, and limited access to voter registration and polling stations. These tactics disproportionately affect marginalized groups, denying them their fundamental right to vote and have a say in shaping their future.
Rwanda’s female government representation
Rwanda has one of the highest rates of female parliamentary representation in the world, with women holding 61.3% of parliamentary seats. This is due in part to the country’s constitutional mandate for at least 30% female representation.
To address this issue, it is crucial to implement policies that promote political inclusivity and representation. Reforms should be made to ensure equal access to political opportunities, support marginalized candidates, and eliminate voter suppression tactics. By doing so, we can pave the way for a more equitable and democratic society for all Kenyans.
Stay tuned for the next section, where we will dive into the final key statistic that sheds light on the education disparities among marginalized communities in Kenya. Together, let us continue to examine the critical data, advocate for change, and strive for lasting transformation.
Key statistic #7: Environmental injustice
According to the World Health Organization, air pollution is responsible for an estimated 7 million deaths each year. This disproportionately affects marginalized communities, who are often exposed to higher levels of air pollution due to their proximity to industrial facilities and waste disposal sites.
Examining the critical data further, another alarming statistic emerges, shedding light on the environmental injustices faced by marginalized communities in Kenya. Sustainable agriculture and climate resilience are pivotal for lasting change, as behavioral analysis predicts a potential 20% reduction in crop yields in Kenya by 2050 due to climate change. This key statistic demands our attention as it highlights the disparities in access to clean water, adequate sanitation facilities, and a healthy living environment.
Studies have shown that marginalized groups in Kenya are disproportionately affected by environmental degradation and pollution. They often reside in areas with limited access to clean water sources and are exposed to hazardous waste and pollutants, leading to various health issues.
Furthermore, these communities bear the brunt of climate change, experiencing severe droughts, floods, and unpredictable weather patterns, which further exacerbate their vulnerability.
Protection of Costa Rica
Costa Rica has made significant progress in reducing its carbon emissions and protecting its environment. The country is now powered by over 98% renewable energy and has one of the largest protected areas in Central America.
Addressing environmental injustice requires a multi-faceted approach. It involves ensuring equitable distribution of natural resources, implementing sustainable practices, and promoting eco-friendly initiatives.
By advocating for environmental justice, we can create a more sustainable and inclusive future for all Kenyans, regardless of their socio-economic status or geographic location.
Stay tuned for the next section, where we will delve into the potential solutions and initiatives aimed at addressing environmental injustices and promoting sustainable development among marginalized communities in Kenya. Together, let us continue to examine the critical data, advocate for change, and strive for lasting transformation.
✨Be the change Kenya needs!
Explore the 7 TOP Alarming Behavioral Analysis for Lasting Change Statistics and arm yourself with insights. 🌍
📥 Download your FREE PDF now and step into the driver’s seat of positive transformation
The power of data to drive lasting change
In the previous section, we discussed some key statistics highlighting the environmental injustices faced by marginalized communities in Kenya. Now, let’s explore how the power of data can drive lasting change in addressing these issues.
Data is a powerful tool that can provide valuable insights and inform evidence-based decision-making. By collecting and analyzing data on environmental degradation, access to resources, and the impact on marginalized communities, we can gain a deeper understanding of the challenges they face and identify effective solutions.
Furthermore, data can help highlight disparities and inequalities, making it a crucial tool for advocacy and policy-making. It empowers us to hold decision-makers accountable and drive meaningful change.
In the next section, we will delve into the importance of data collection and analysis, and its role in creating targeted interventions and policies. Join us as we explore the transformative potential of harnessing data to create a more just and sustainable future for all in Kenya.
Using data to empower marginalized communities
In conclusion, we have seen the power of data in empowering marginalized communities in Kenya. By collecting and analyzing data on environmental injustices, access to resources, and the impact on these communities, we can truly understand the challenges they face and work towards effective solutions.
Data not only helps us advocate for change and hold decision-makers accountable, but it also plays a crucial role in creating targeted interventions and policies. By harnessing the transformative potential of data, we can create a more just and sustainable future for all in Kenya.
It is important for organizations, governments, and individuals to invest in data collection efforts and ensure that marginalized communities have a voice in shaping their own futures. Together, with the power of data, we can drive lasting change and create a society where everyone has equal opportunities and rights.
Be ready to dive further into community-led development through the 6 Stages of Change for Uplifting People Navigating Transformation next.
Share the post on social media using the social sharing buttons on this page.
Make reference to
- UNESCO Institute of Statistics. (2022). Education Statistics.
- World Bank. (2023). Gender Equality, Poverty Reduction, and Inclusive Growth.
- UNICEF. (2022). Water, Sanitation, and Hygiene.
- International Institute for Sustainable Development. (2023). Climate Change and Agriculture.
- Equity and Education Initiative. (2022). Scholarships for Marginalized Communities.
- FAO. (2022). Sustainable Farming Practices.
- UNFPA. (2022). Ending Female Genital Mutilation.
- UN Women. (2022). Gender Sensitization Programs.